With XRP now sitting at $2.30 to $2.31 over the last hour, marking a modest 1.6% gain for the day, the coin sports a market capitalization of $138 billion and a 24-hour trading volume of $2.48 billion. A tightly wound intraday range between $2.25 and $2.33 hints at caution beneath the surface sparkle.
XRP Chart Outlook
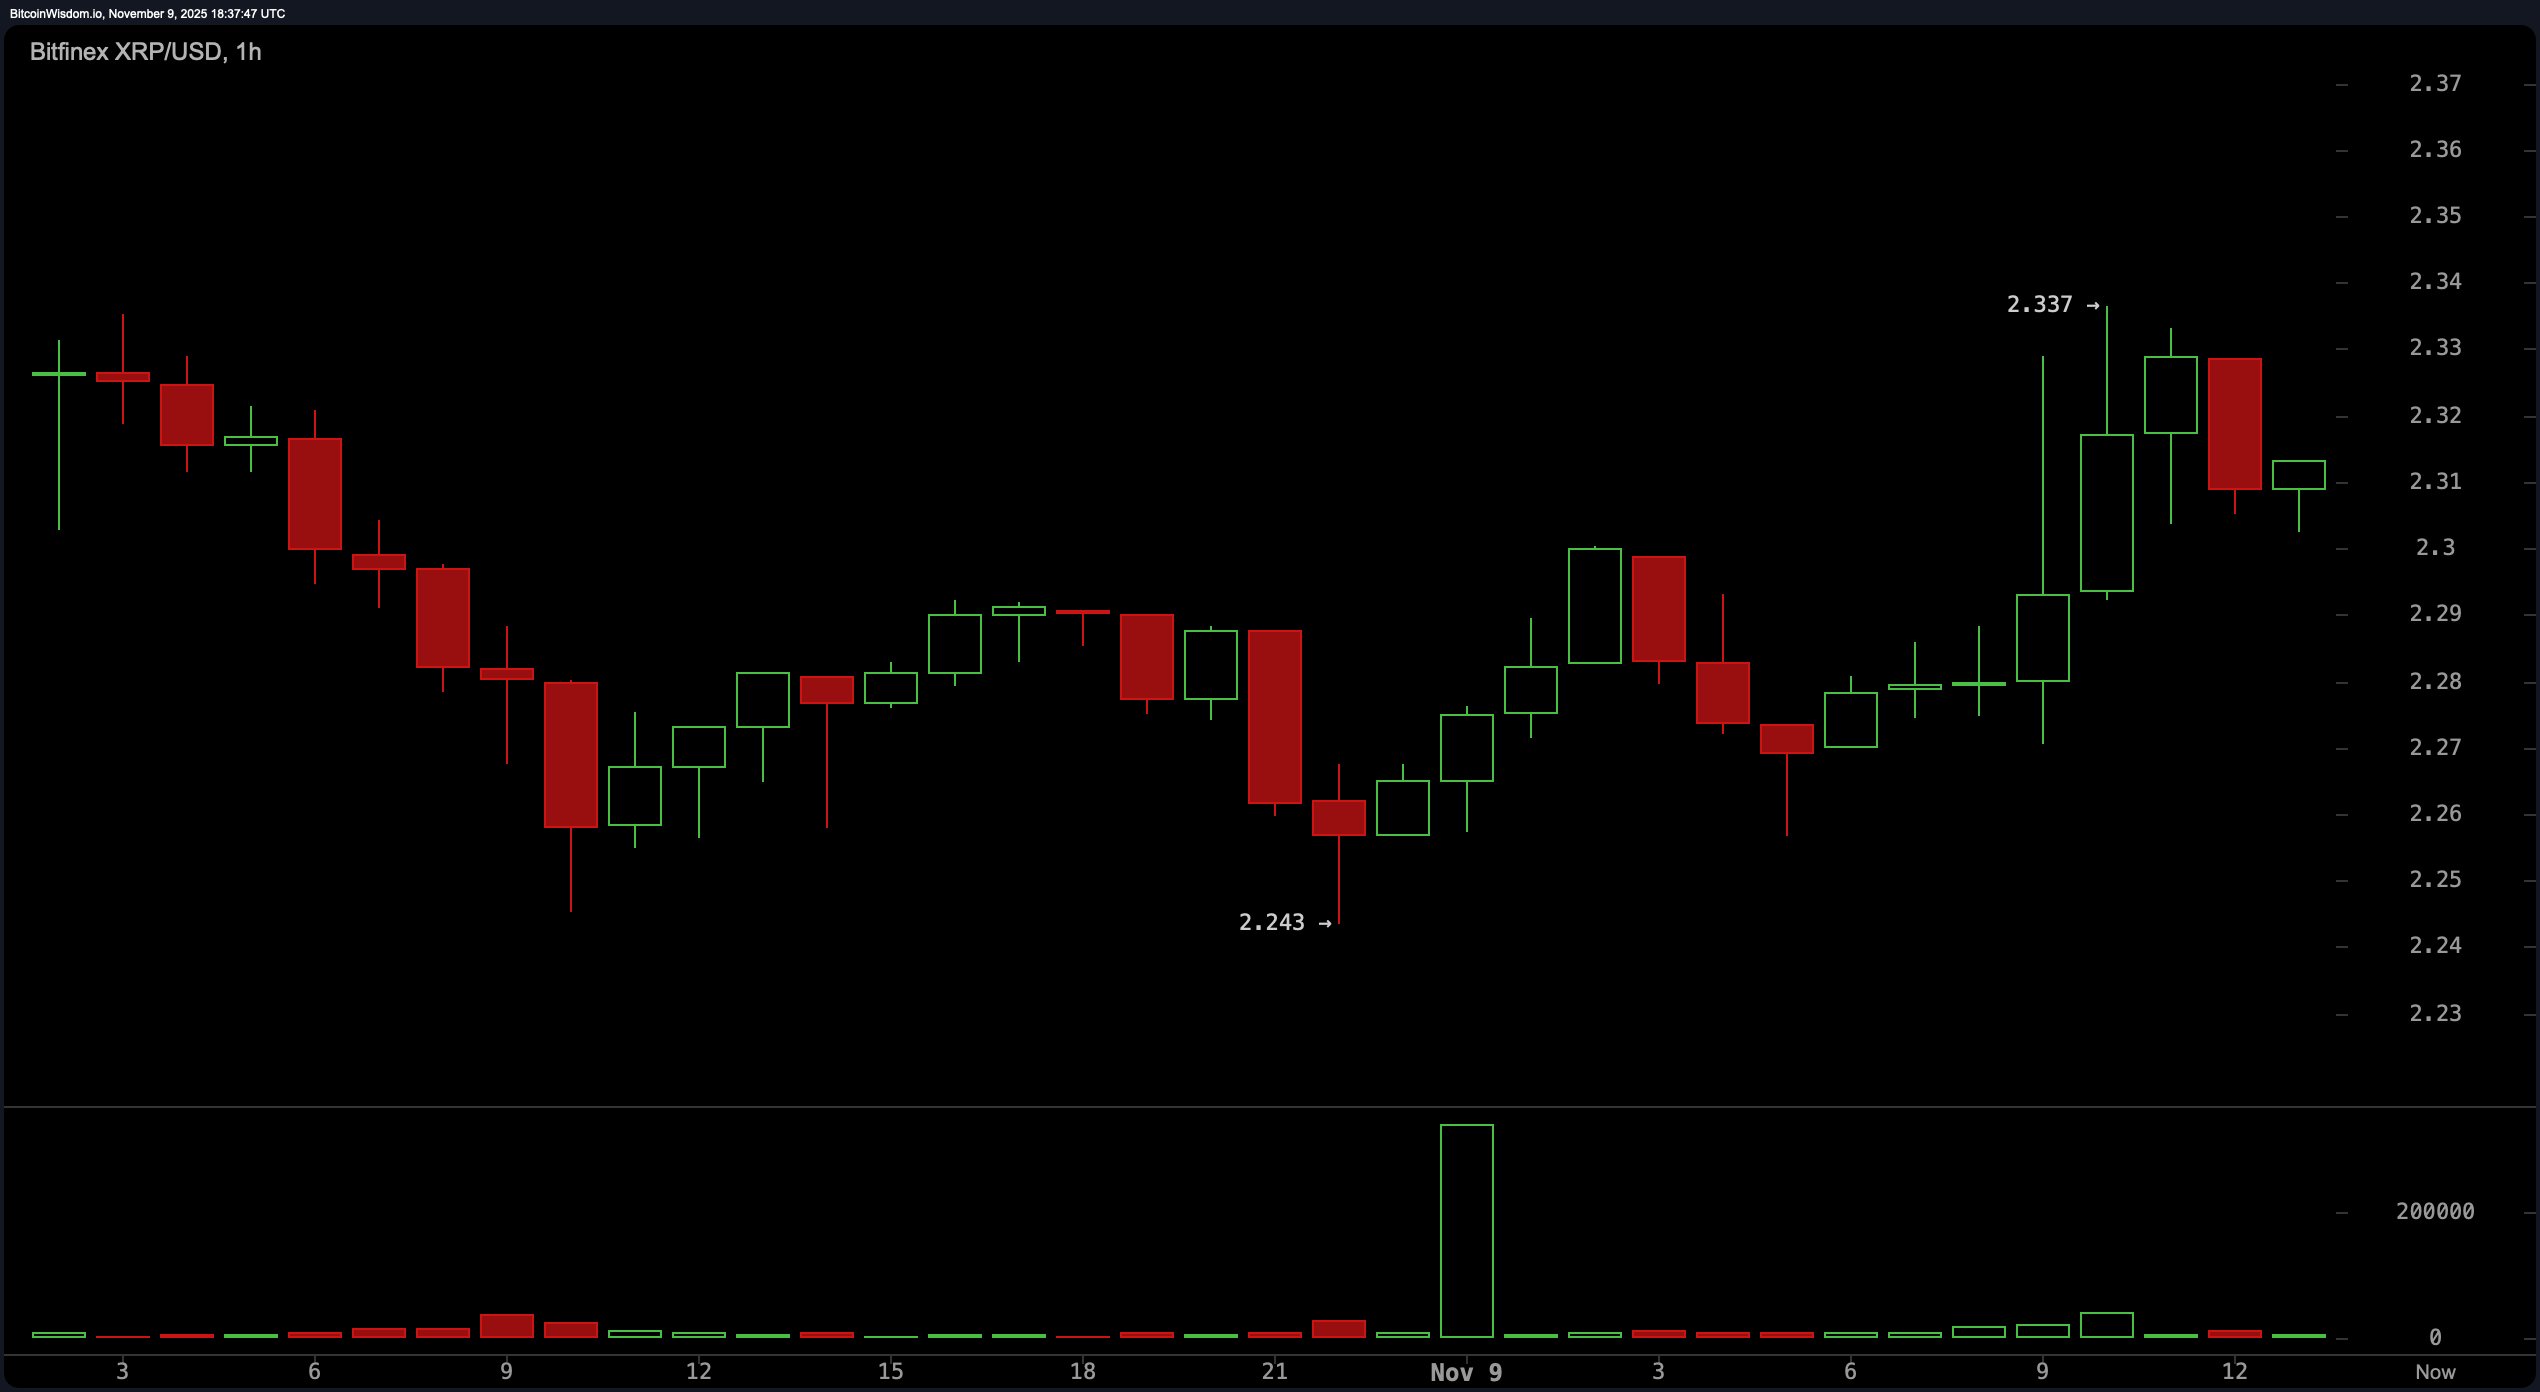
Let’s kick things off with the 1-hour XRP chart, which is giving a subtle wink of bullishness. The recent move from $2.24 to $2.33 stitched together a tidy ascending structure, supported by an uptick in volume on green candles.
Yet, the moment price kissed $2.34, it ran into resistance and left a bearish candle in its wake, hinting at near-term exhaustion. Support holds firm between $2.28 and $2.30, but unless volume floods in above $2.36, this baby rally might be running on fumes.
 XRP/USD 1-hour chart via Bitfinex on Nov. 9, 2025.
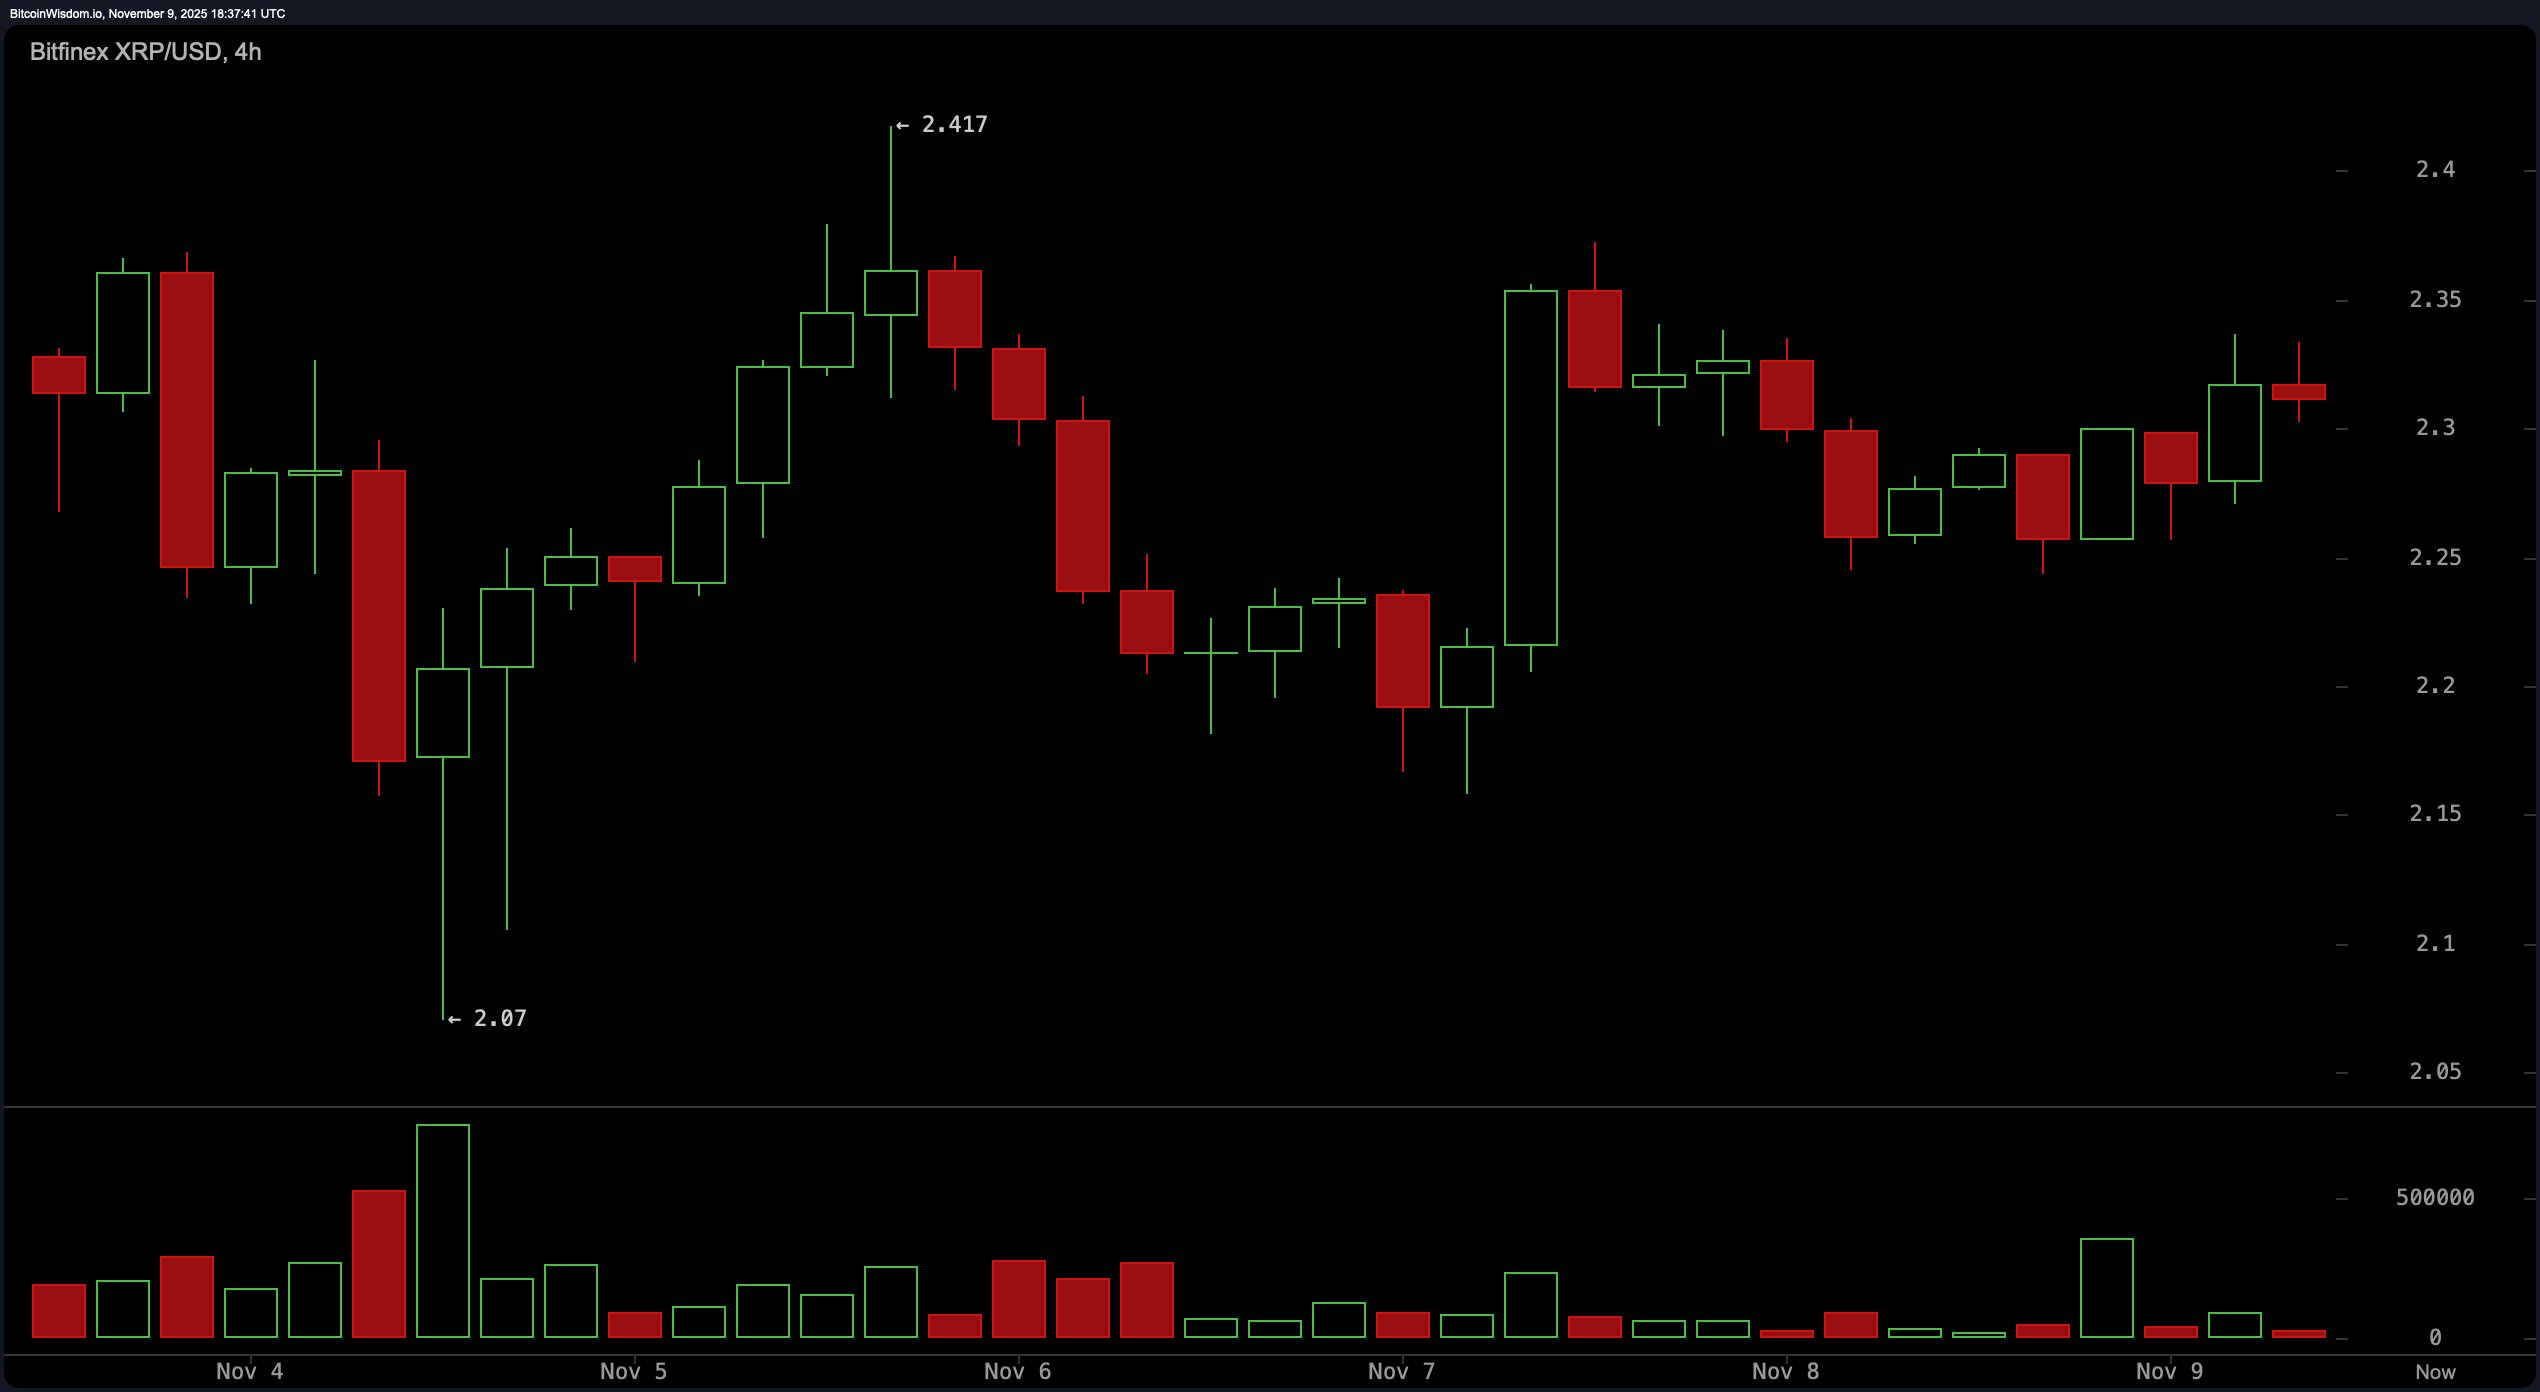
On the 4-hour chart, XRP is channeling its inner pendulum—oscillating in a range but nudging higher with each swing. After rebounding from $2.07 to $2.41, price action has formed higher lows, possibly signaling accumulation. The double top around $2.41–$2.43 is the real party crasher here, preventing further upside. That said, a meaty green volume bar following the $2.07 bounce whispers of underlying demand. Support at $2.25 and $2.07 remains the backbone of this mini comeback.
 XRP/USD 4-hour chart via Bitfinex on Nov. 9, 2025.
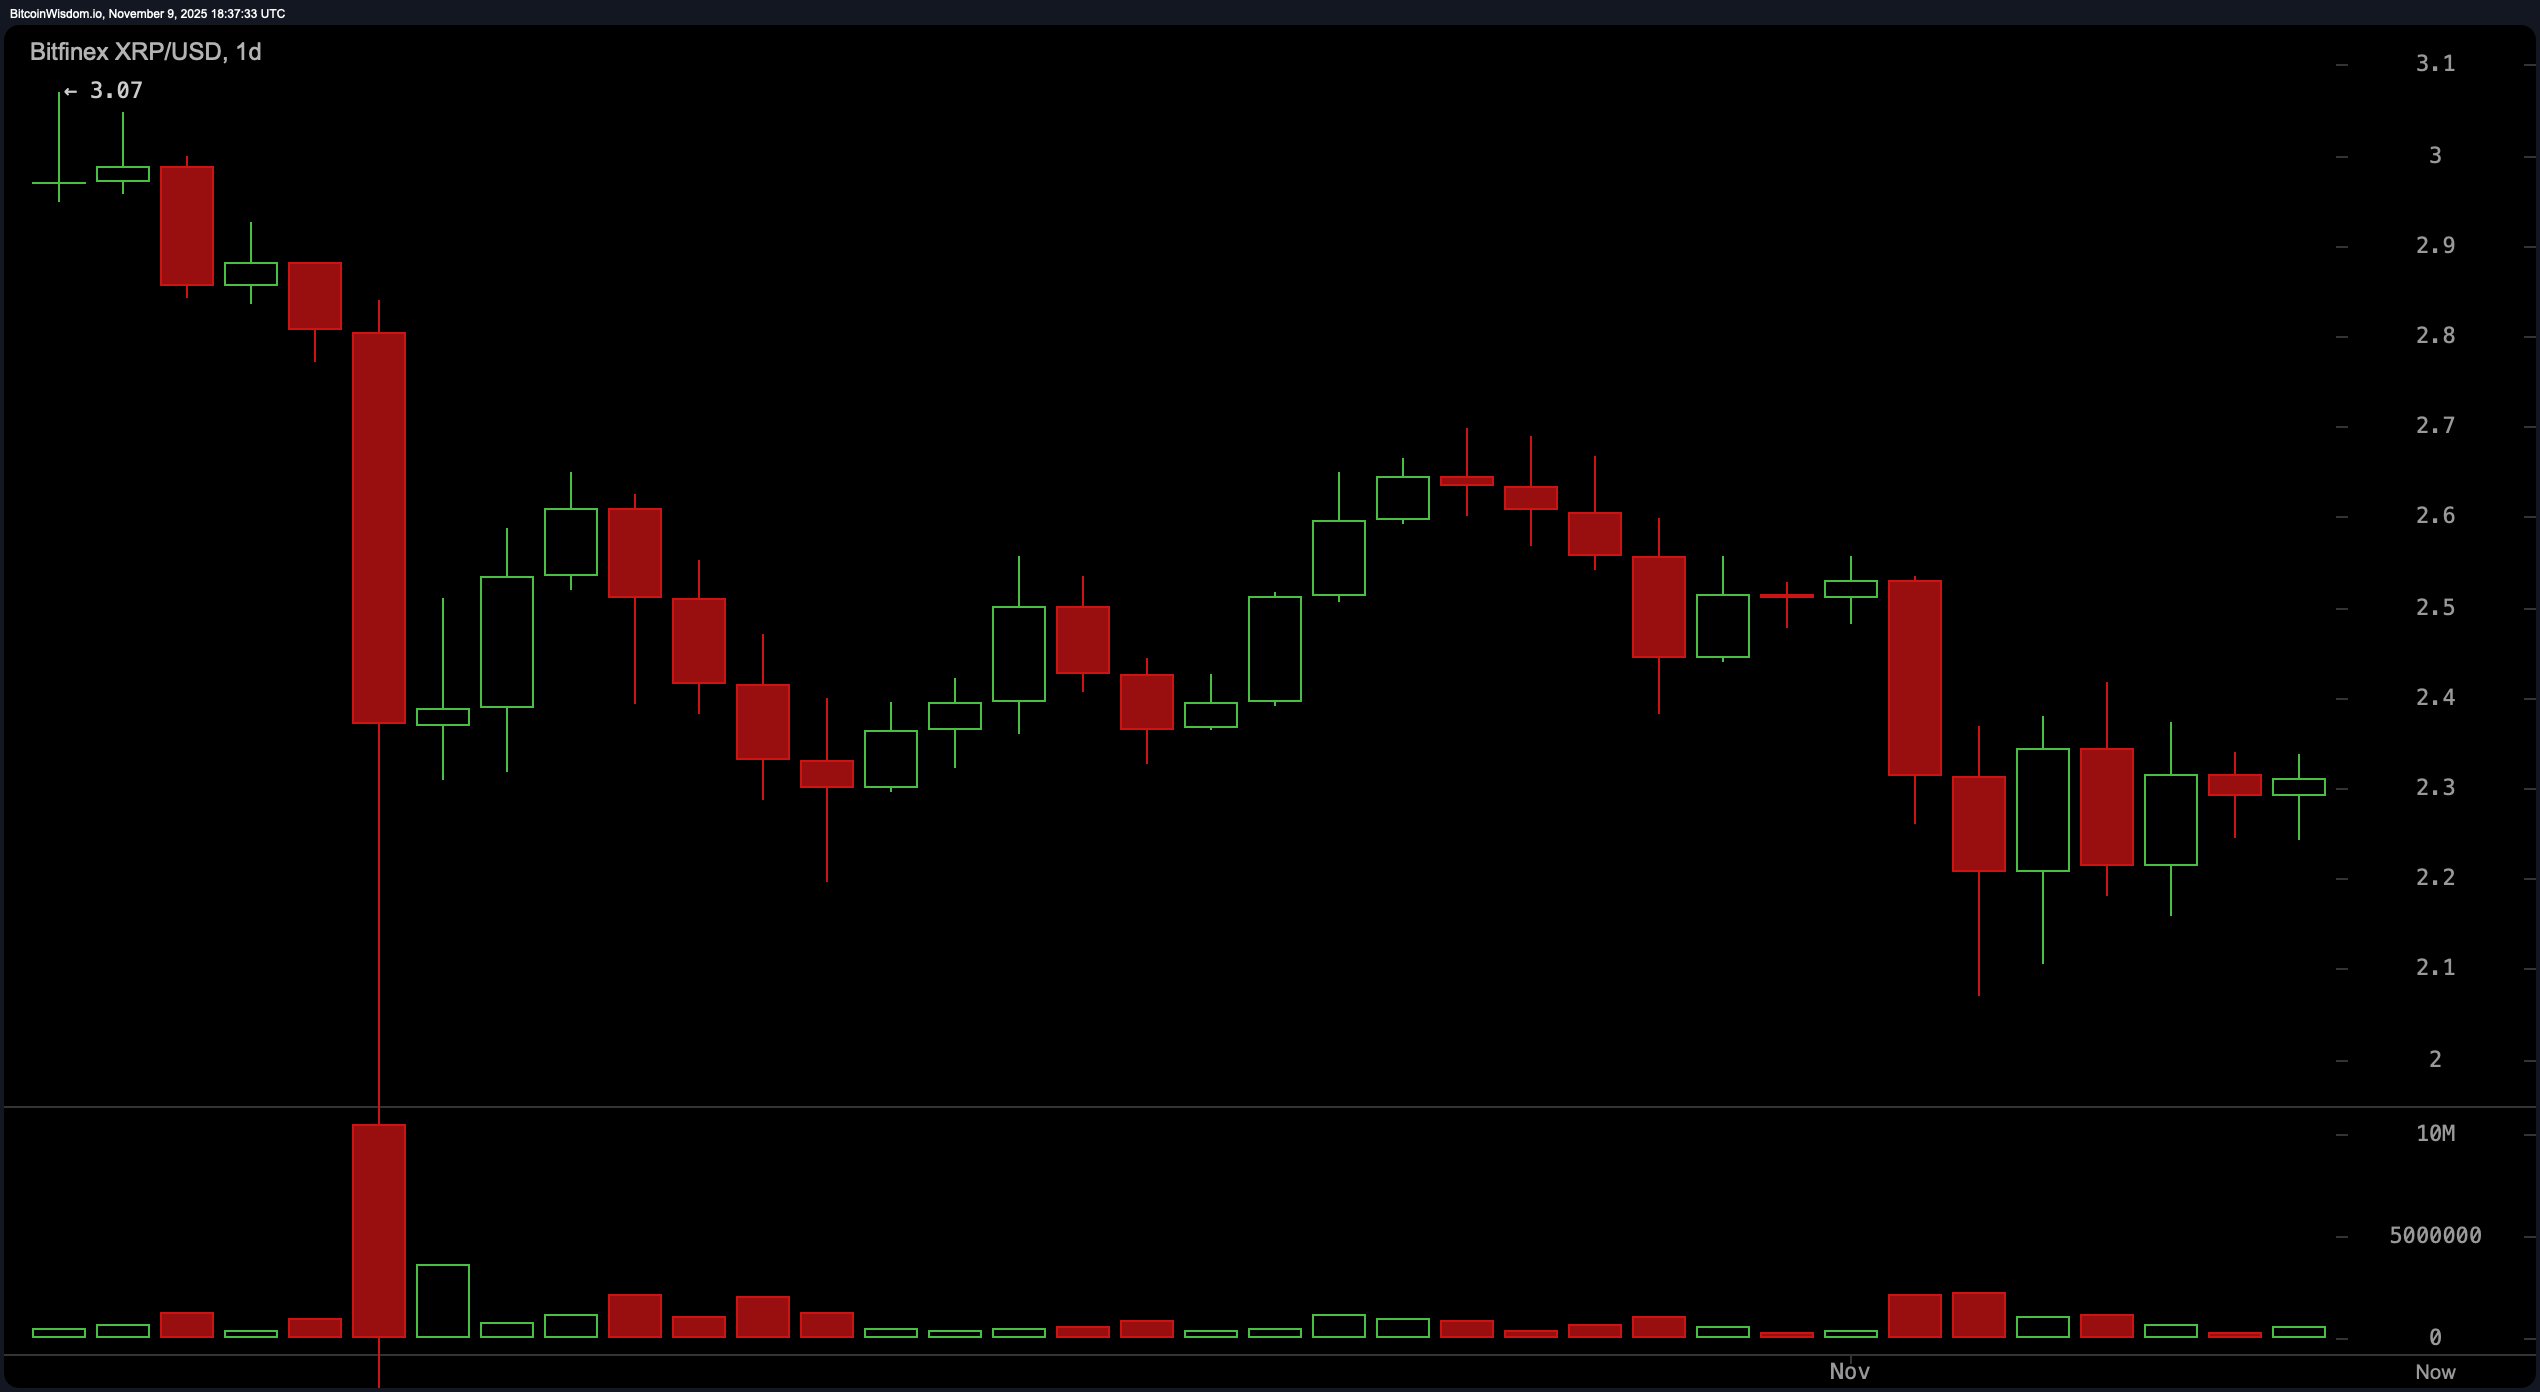
Now, zooming out to the daily chart, things get a little murkier. The plunge from around $3.07 to $2.30 was sharp and loud—your classic capitulation-style flush. Since then, XRP has coiled itself in a tight sideways chop between $2.15 and $2.40. The lack of conviction in recent candles and muted volume shows a market unsure of its next move. Resistance at $2.50 looms large, while $2.10 is the final stand before a likely retreat to $1.95.
 XRP/USD 1-day chart via Bitfinex on Nov. 9, 2025.
, it’s a mixed bag of shrugs and sighs. The relative strength index (RSI) is at 42.49, comfortably in neutral territory. The Stochastic oscillator clocks in at 37.31, also neutral, as does the commodity channel index (CCI) at −81.69. The average directional index (ADX) sits at a relatively strong 40.62, but without a clear trend confirmation. The Awesome oscillator (AO) gives us a slightly negative read of −0.18977. Momentum is one of the few with an upbeat note at −0.13484, and the moving average convergence divergence (MACD) level shows −0.08859, echoing a bearish divergence. In short: it’s a cocktail of indecision, with a splash of hesitation.
As for , XRP is looking less like a high-speed train and more like it missed its station. Every single short- to long-term indicator is flashing red. The exponential moving averages (EMAs) for 10, 20, 30, 50, 100, and 200 periods are all beneath the current price, ranging from $2.343 to $2.655. Their simple moving average (SMA) counterparts echo the same sentiment, with the 10-period SMA at $2.351 and the 200-period at $2.627. Translation? XRP’s price is cruising below these key averages—hardly a glowing endorsement.
Bull Verdict:
XRP could be gearing up for another push if it can break above $2.36 with strong volume, reclaiming lost ground from its recent capitulation. Short-term momentum on the 1-hour and 4-hour charts hints at accumulation, and if the daily range resolves to the upside, a move toward the $2.50–$2.60 resistance band is not off the table.
Bear Verdict:
Despite minor intraday bounces, XRP remains trapped beneath every key moving average from short to long term. The daily chart reveals a classic post-drop stall, and without a decisive break above $2.43, the risk of revisiting $2.10—or even lower—is still firmly on the table.
FAQ ❓
- What is XRP’s current price? XRP is trading at $2.30 as of November 9, 2025.
- Is XRP trending up or down today? is up 1.6% on the day but remains below key moving averages.
- What are XRP’s key resistance and support levels? Resistance is near $2.36 and $2.50, with support at $2.28 and $2.10.
- What do XRP’s charts suggest next? shows short-term bullish signals but faces longer-term bearish pressure.
Author: Jamie Redman
Source: Bitcoin
Reviewed By: Editorial Team


