XRP’s price is trading between $2.99 and $3.00 per coin over the last hour, marking a 1.4% increase on the day and a 7% gain over the past week. The cryptocurrency holds a market capitalization of $299 billion, with a 24-hour trading volume of $4.69 billion and an intraday price range of $2.94 to $3.07.
XRP Chart Outlook and Price Prediction
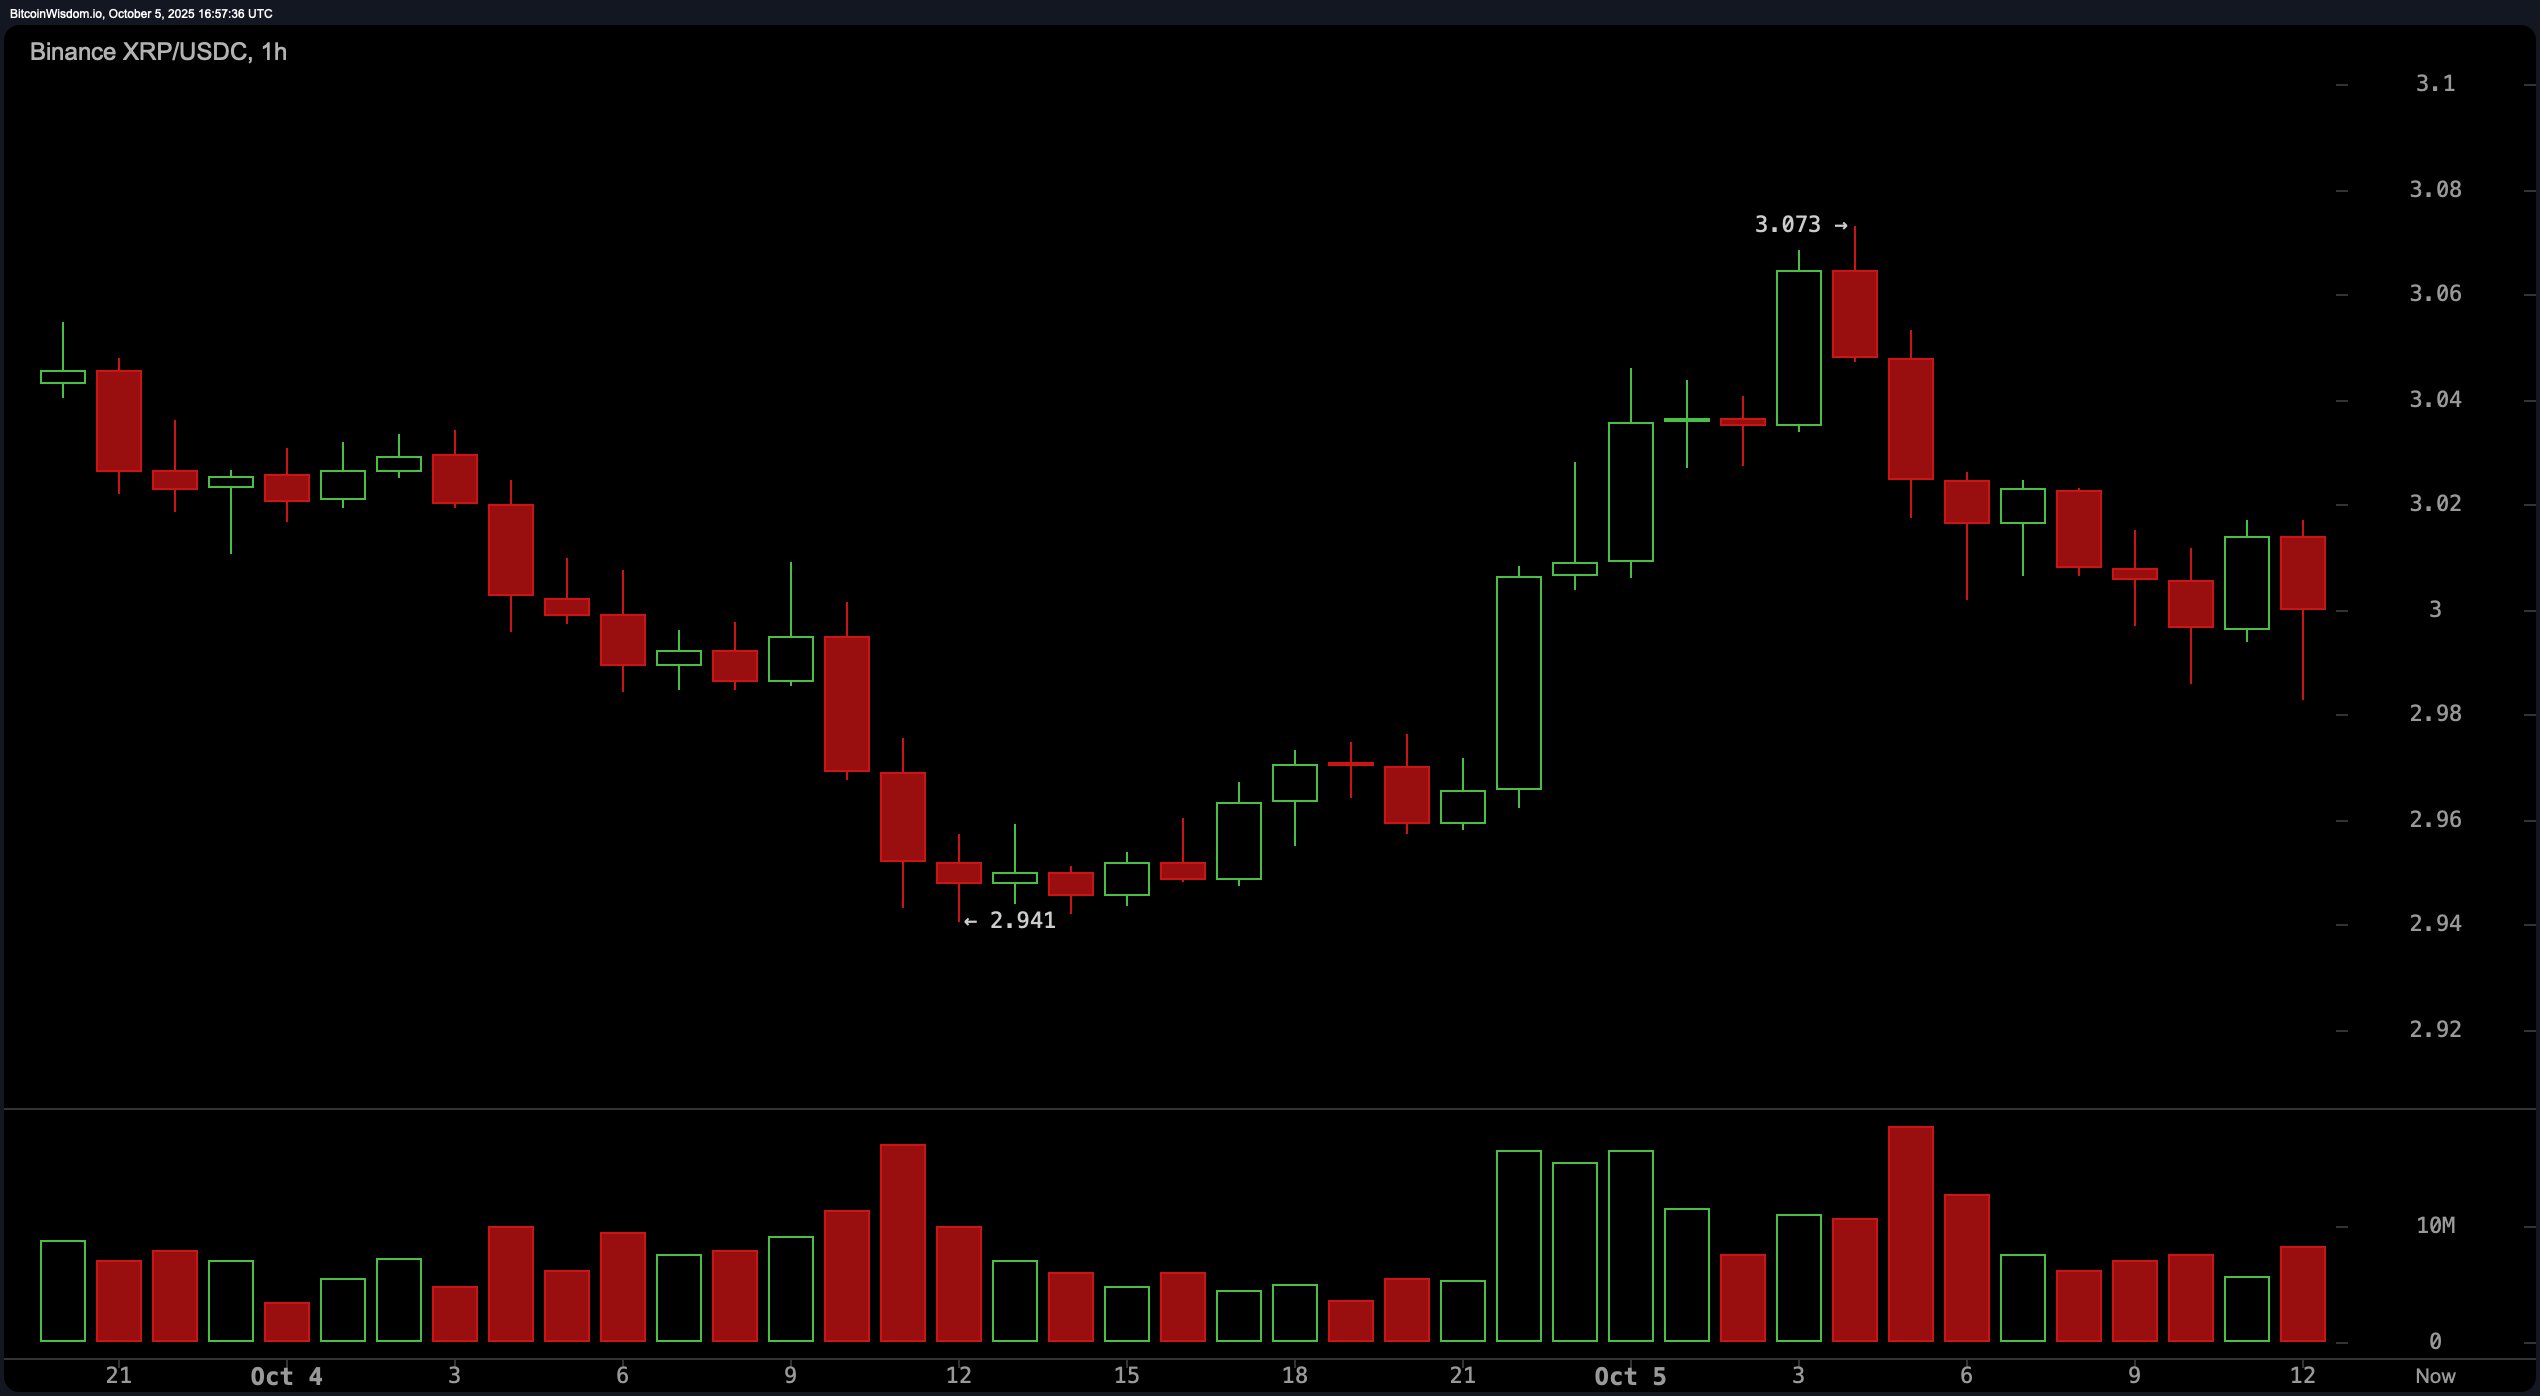
The 1-hour chart is dancing on a fine line between tactical precision and potential chaos. is range-bound at the $3.00 level, tracing a descending channel that’s acting like a cranky doorman blocking entry to the VIP zone above. Bulls charged at $2.94 with a textbook V-shaped recovery, but the party hit resistance near $3.07—where sellers reappeared like bad exes at a reunion.
The price action has turned a little shady in the last few candles, so scalpers are on alert. A tight buy zone between $2.97 and $2.98 looks tempting, but a stop below $2.94 is the seatbelt you need in this ride. Break below? Buckle up, we’re heading south.
 /USDC via Binance 1-hour chart on Oct. 5, 2025.
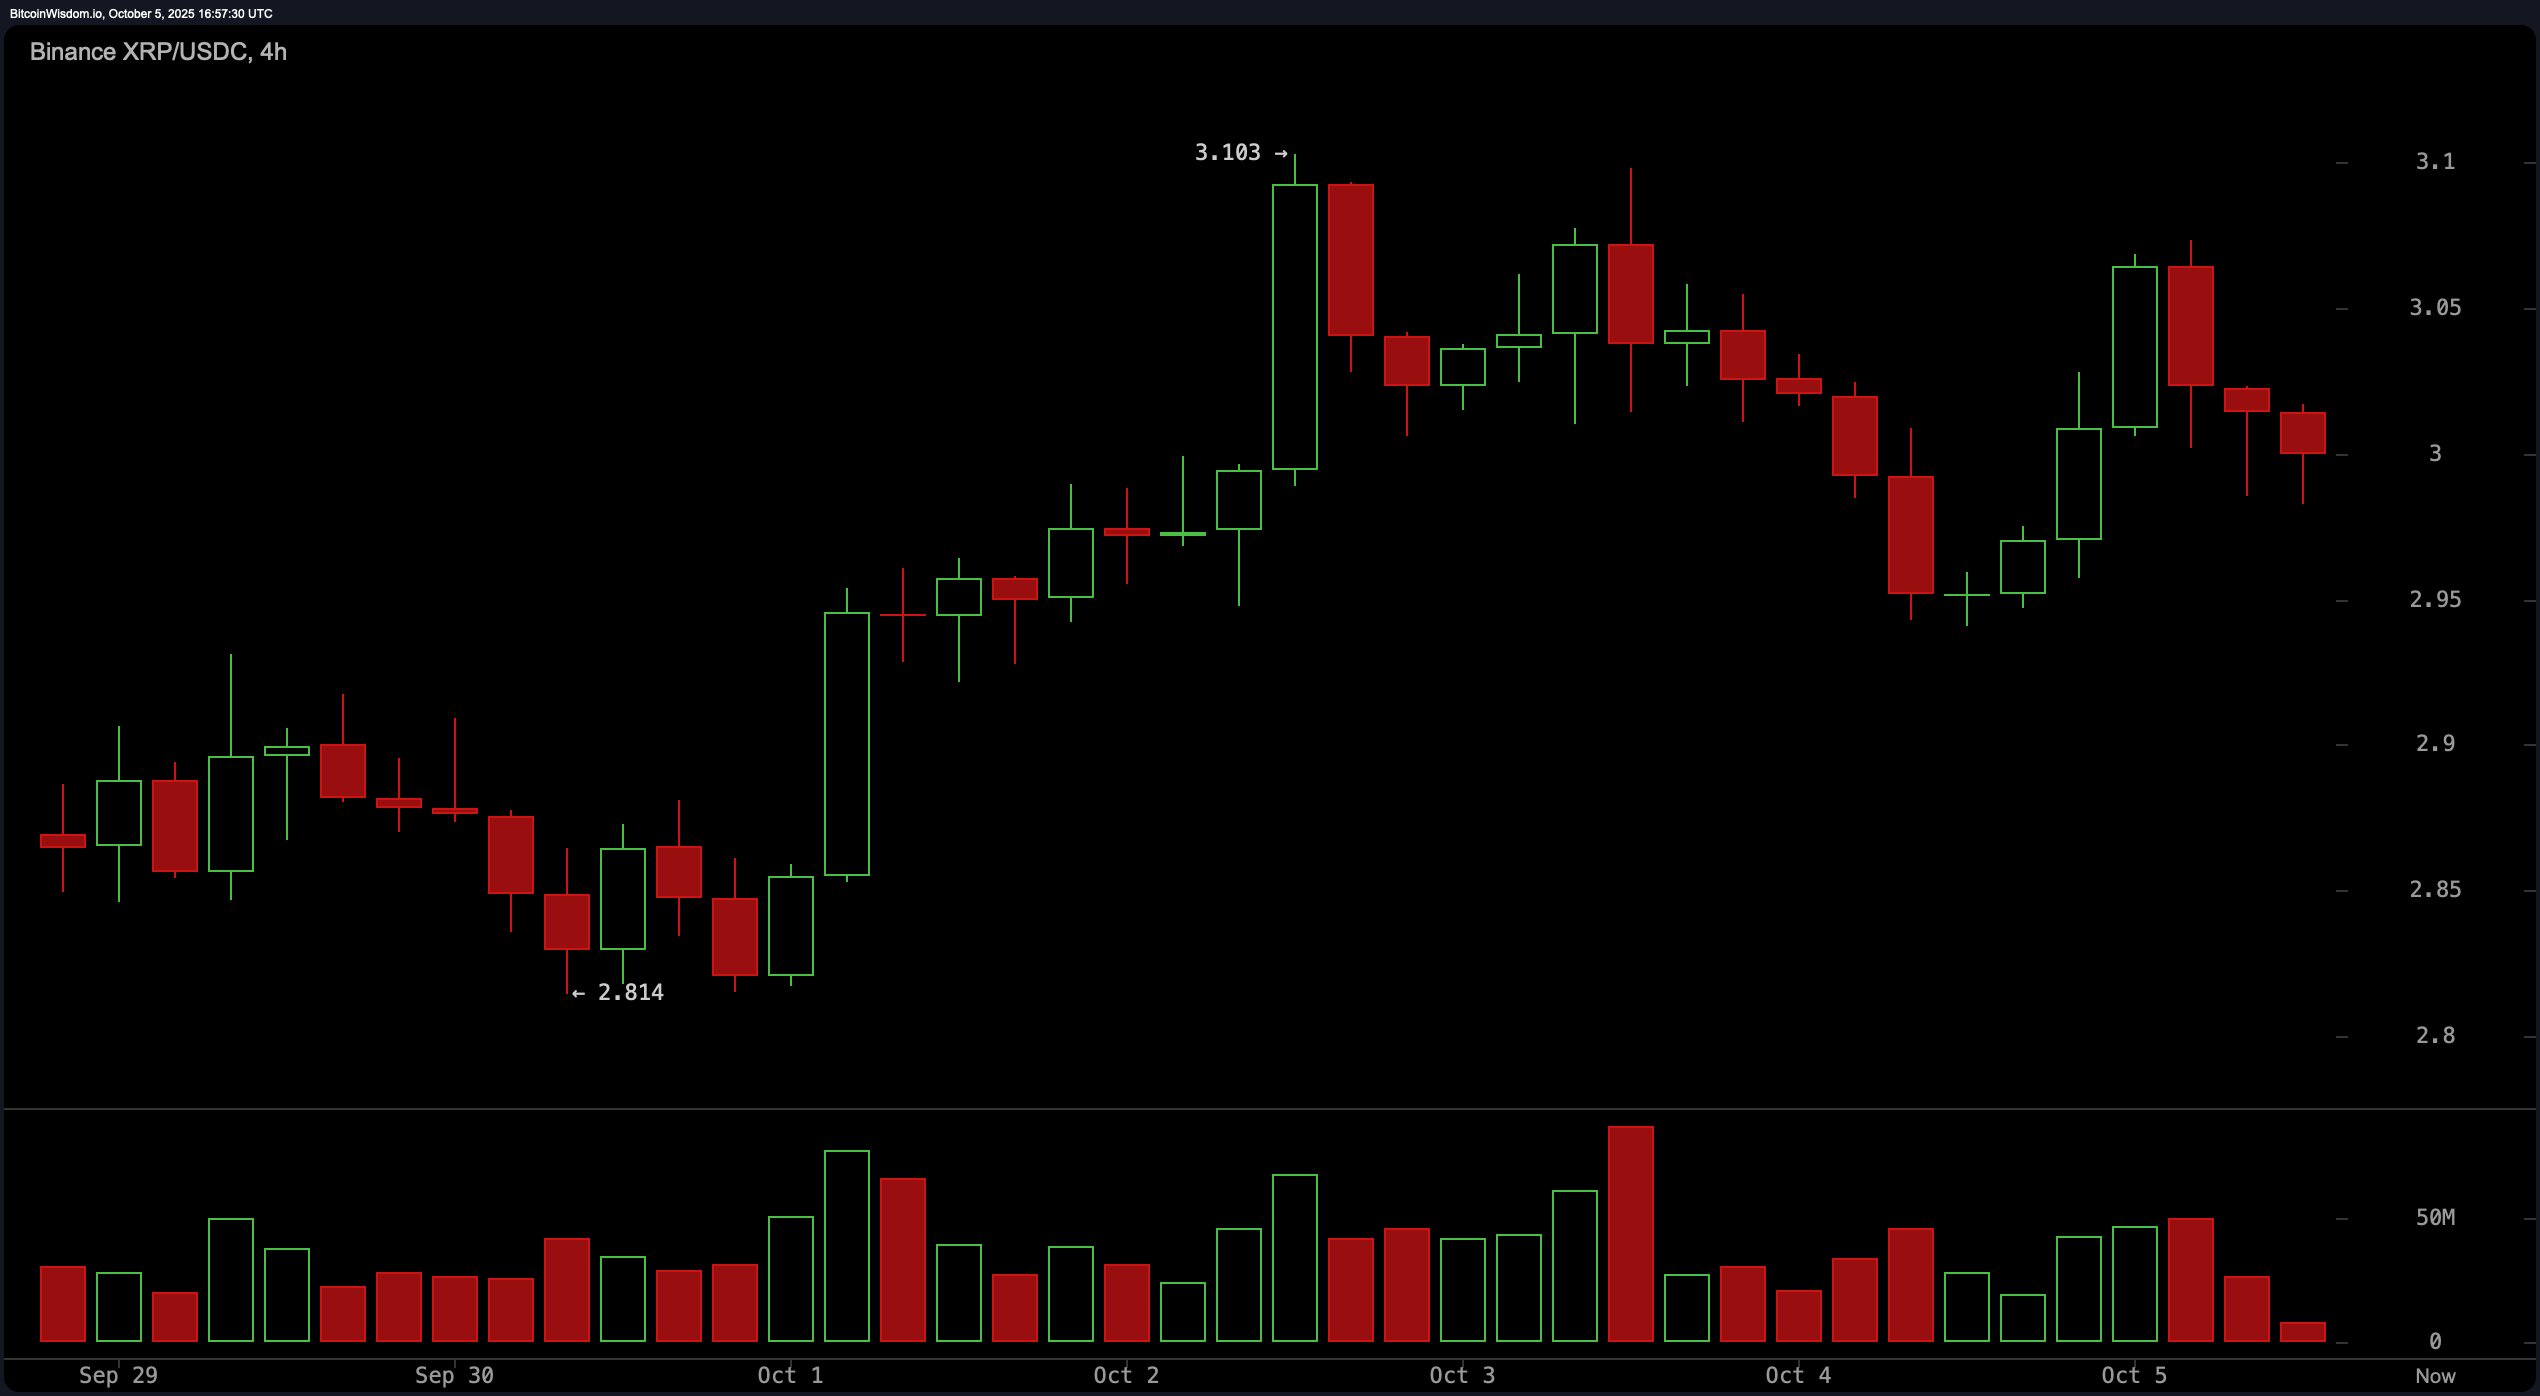
Over on the 4-hour chart, appears to be hitting the snooze button after a brisk run-up. Price hit a high of $3.103 before pulling back, now loitering around $3.00 like it’s not sure whether to commit or ghost the rally altogether. Lower highs and lower lows are creeping in, hinting at short-term exhaustion. The volumes in retreat too—traders are either cautious or already on lunch. For the clever tactician, there are two options: play the breakout at $3.05 or the bounce off $2.95. Anything in between? That’s no-man’s land—avoid the drama.
 /USDC via Binance 4-hour chart on Oct. 5, 2025.
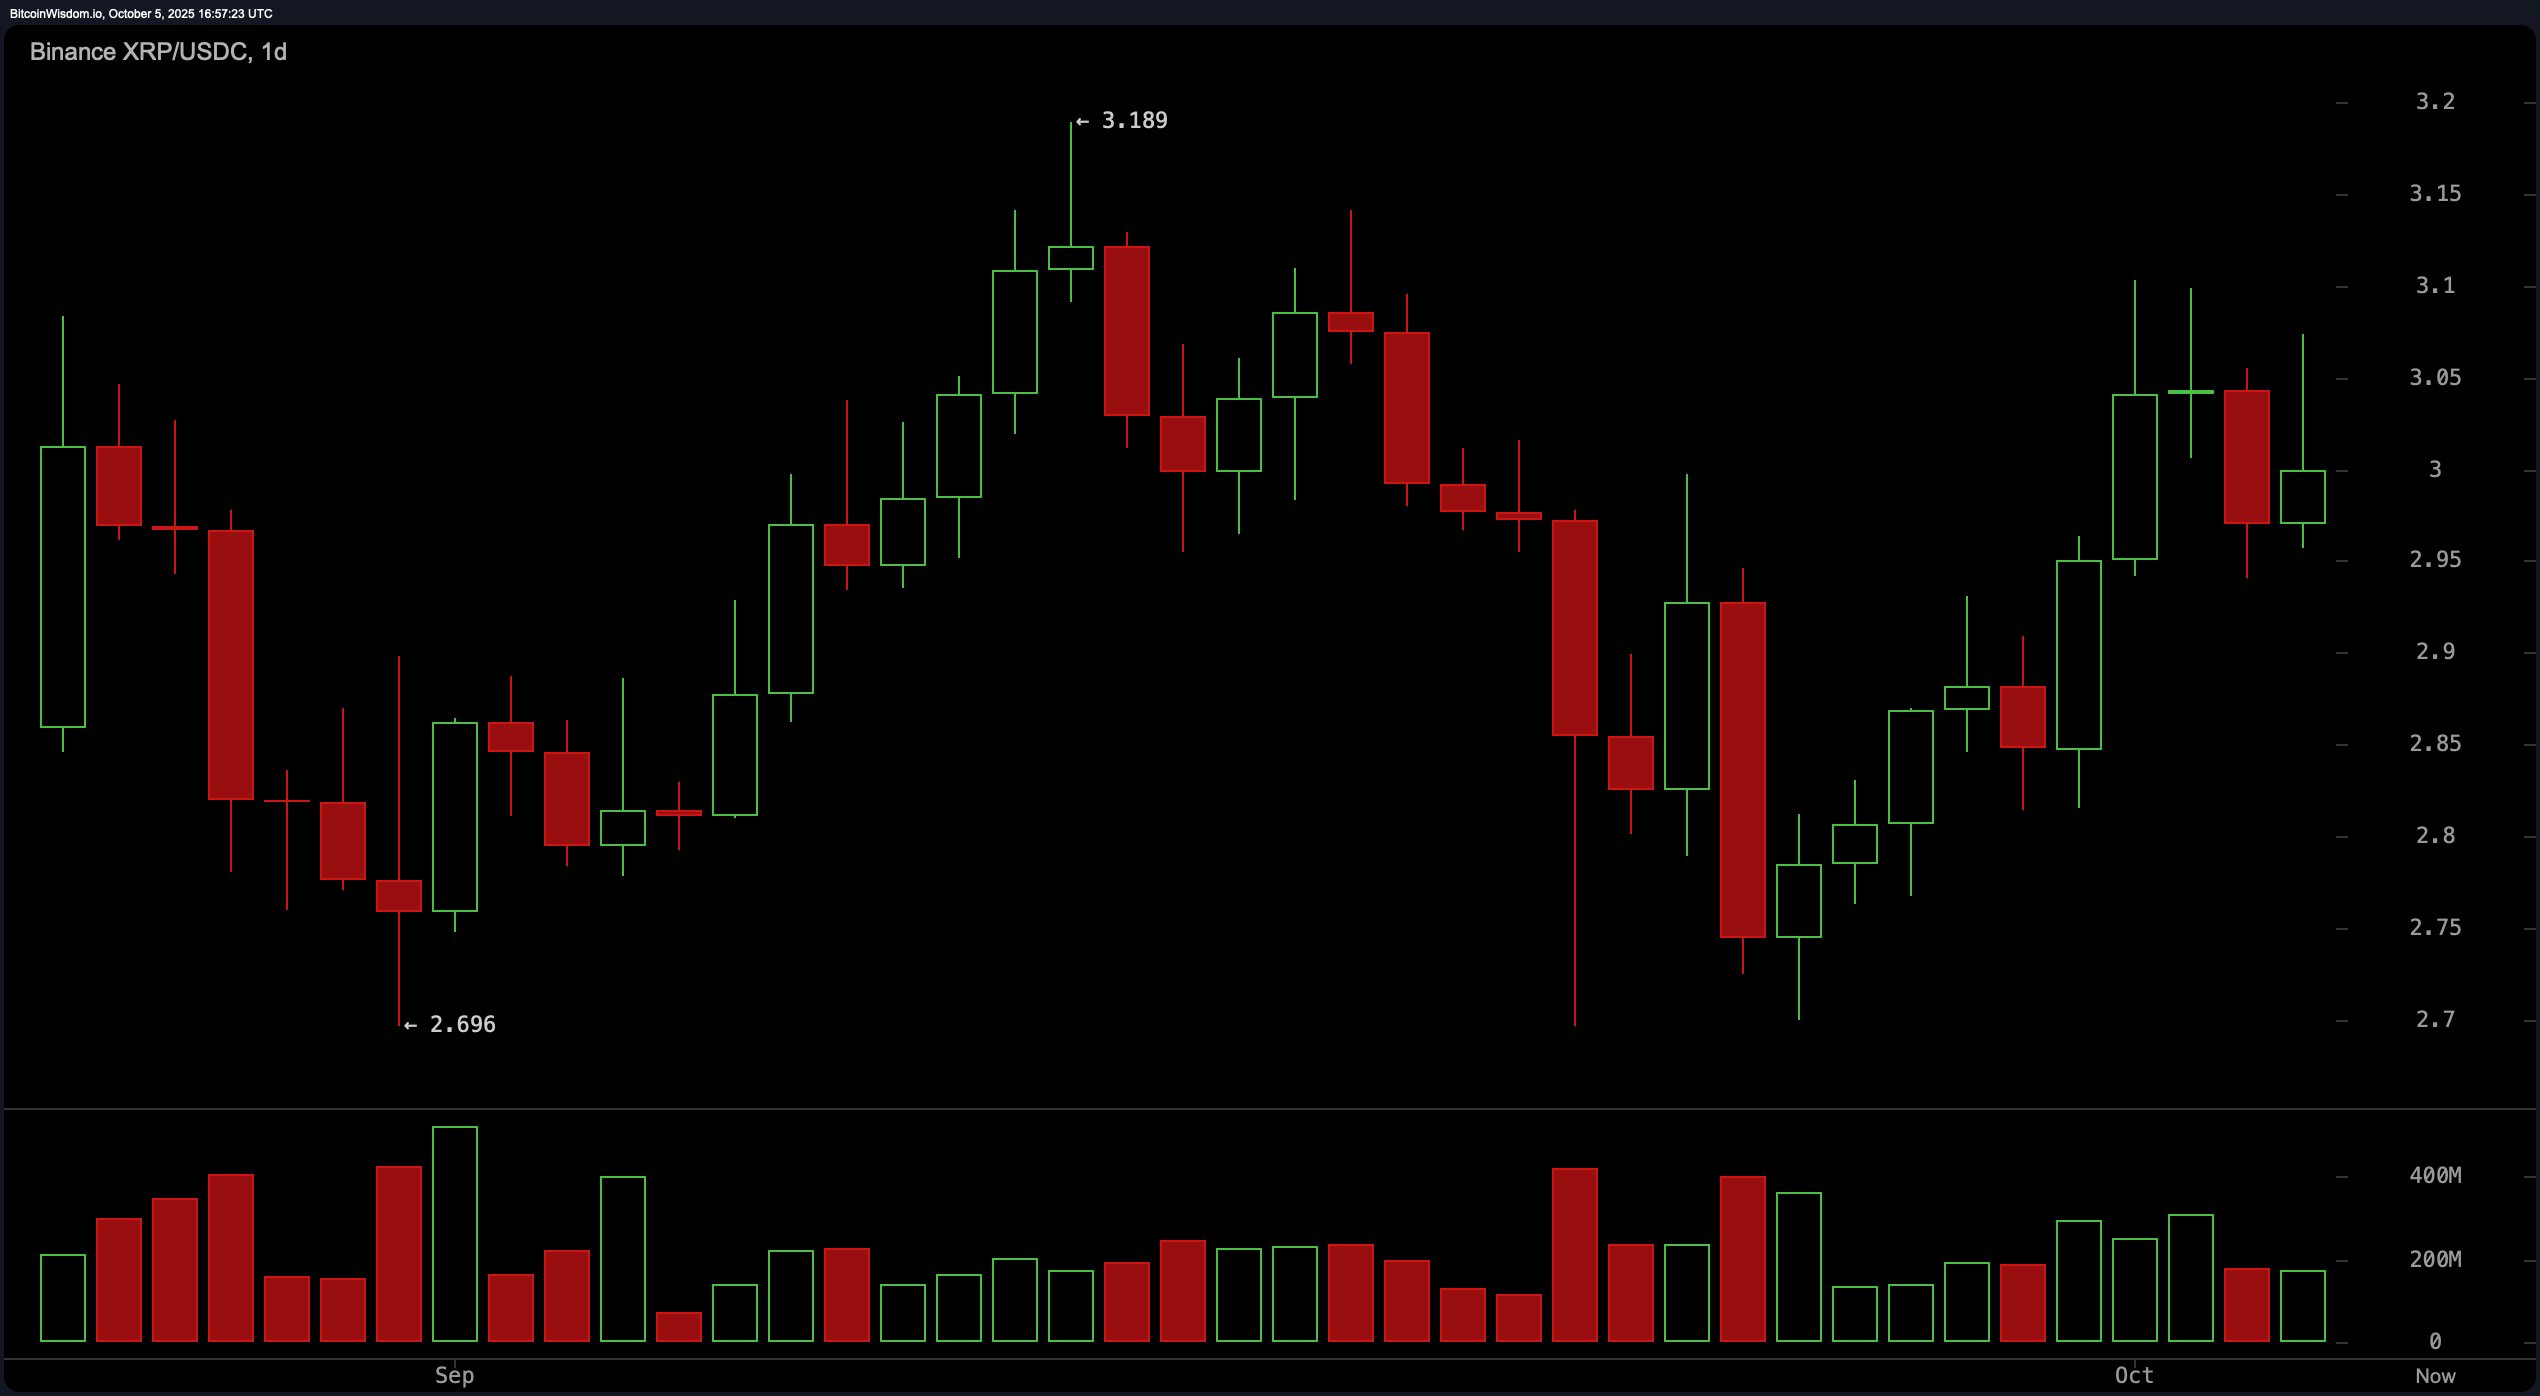
The daily chart paints a more flattering portrait of —she’s in her recovery era. After a dramatic drop from $3.18, buyers showed up strong at the $2.70 reversal zone, sparking a medium-term bounce. Volume surged at the bottom, a classic sign of accumulation, but now tapers off slightly above $3.00—suggesting a bit of hesitation. Resistance stands tall at $3.10 to $3.18, the former throne fell from. Support, meanwhile, is quietly stacking between $2.90 and $2.95. Bulls eye a confirmed breakout and daily close above $3.10 to re-enter the limelight. Anything less is a tease, not a trend.
 /USDC via Binance 1-day chart on Oct. 5, 2025.
Now let’s get technical with the . The relative strength index (RSI) is lounging at 53.81—dead-center and noncommittal, signaling neutrality. The Stochastic oscillator echoes the same with a reading of 75.07. Commodity channel index (CCI) at 55.51 and average directional index (ADX) at a sleepy 14.12 aren’t offering any hot takes either. But wait—momentum says otherwise. The Momentum indicator has perked up at 0.25, sending a subtle bullish whisper. And our trend-following diva, the moving average convergence divergence (MACD), joins the bullish camp with a 0.006 reading. Translation? Momentum’s gently rising, even if the broader sentiment is playing hard to get.
, however, are practically singing hallelujah in unison. Every single trendline—whether it’s the exponential moving averages (EMAs) or the simple moving averages (SMAs)—from 10 to 200 periods, are screaming bullish. EMA-10 through EMA-200 and SMA-10 through SMA-200 are all pointing north, supporting a strong structural foundation for ’s price. It’s rare to see this level of harmony across such a wide time spectrum—so unless the market throws a tantrum, looks poised for further upside if that $3.10 ceiling cracks. In other words, the bulls have the green light; they just need to press the gas.
Bull Verdict:
If successfully closes above the $3.10 resistance level on strong volume, the bullish structure across all major moving averages and positive momentum indicators suggest further upside potential toward $3.18–$3.20. Buyers appear positioned to maintain control, provided support holds above $2.95, reinforcing a bullish continuation pattern in both short- and medium-term timeframes.
Bear Verdict:
If fails to break above $3.10 and instead loses the $2.94–$2.95 support zone, short-term bearish pressure could accelerate, leading to a retest of lower support levels around $2.90 or below. Weak volume at key resistance levels and a lack of conviction from oscillators could indicate a loss of momentum, placing the current rally at risk of reversal.
Author: Jamie Redman
Source: Bitcoin
Reviewed By: Editorial Team


